Projects

Apps, dashboards, and analytics work across Streamlit, Dash, Tableau, Power BI, and Excel.

Freedom Index Dashboard screenshot

Global Freedom Index Dashboard

Interactive analytics dashboard providing an overview of the Freedom index by country or by regions based on the Freedom House.

StreamlitPlotlyPandas
Population Trend app screenshot

Population Trends

Interactive World Population Indicators Dashboard , filtered by Regions, Income Group and Years.

PlotlyOpenpyxlCSS
Population Trend app screenshot

Taxi Trip Dashboard in NYC

Taxi Trips in NYC boroughs in March 2019.

TableauBIExcel
scatterplot app screenshot

Dash KPI Dashboard

dynamic scatterplot of country population indicators, and time series analysis by Regions and Income Group from 1980 to 2023.

DashPlotlyCSS
Population Trend app screenshot

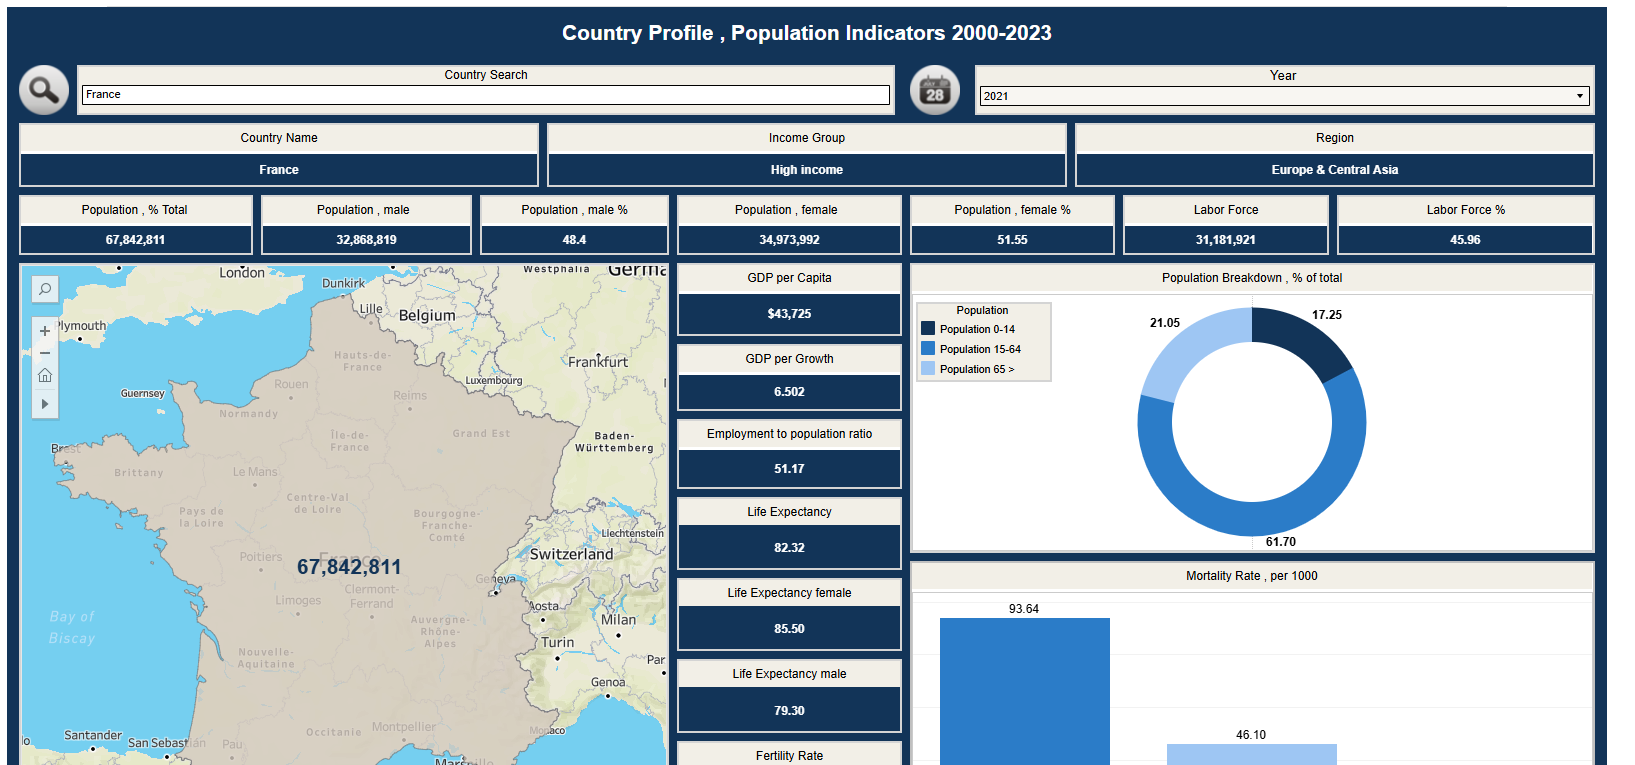
Tableau Country Profiles

A demographic breakdown by country of birth , age , race ,gender , primary language etc. It includes comparative tables between countries.

TableauBIStorytelling